
TORONTO, July 15, 2026 (GLOBE NEWSWIRE) -- TRX Gold Corporation (TSX:TRX) (NYSE:TRX) (the "Company" or "TRX Gold") reported its results for the third quarter of 2026 ("Q3 2026") for the three and nine months ended May 31, 2026. Financial results are available on the Company’s website at www.TRXgold.com. Unless otherwise noted, all references to currency in this press release refer to US dollars.
TRX Gold’s CEO, Stephen Mullowney commented: "Our Q3 2026 results demonstrate that our investments in plant optimization are delivering measurable improvements and further reinforce the strength and scalability of our asset. Over the last twelve months ("LTM") we have generated $115.5 million in revenues, adjusted EBITDA1 of $66.8 million and operating cash flow of $28.9 million – in Q3 alone we achieved adjusted EBITDA1 of $20.7 million. Over the same LTM time period we have made $46.4 million in investments at Buckreef Gold, including $27.1 million in capital assets and $19.3 million in working capital. With a current adjusted EBITDA run rate higher than the LTM period, cash on hand of $26.8 million, working capital investment having already been made, significant undrawn credit lines, and essentially being debt free, we are currently well positioned to fund our capital program over time. Our accelerated plant expansion is laying the foundation for the next stage of growth, which will include both a 3,500 tpd SAG mill circuit and significant upgrades to our existing 2,000 tpd plant – with a combined processing capacity which is well beyond the 3,000 tpd plant capacity as outlined in our PEA last year, unlocking significant value. As an added bonus, we have already achieved our full year guidance as of today, having produced over 25,000 ounces of gold fiscal year to date."
Key highlights for Q3 2026 and Year to Date in 2026 include:
- Record Throughput Drives Strong Production Momentum, Cash Flow and Profitability: During Q3 2026, Buckreef Gold achieved record processing plant throughput, and poured 7,426 ounces of gold, an increase of 58% from the prior year, and sold 6,983 ounces, an increase of 75% from the prior year, at a record average realized price1 of $4,703 per ounce. The Company recognized revenue of $32.9 million, gross profit of $19.5 million, gross profit margin of 59%, adjusted net income1 of $10.1 million, operating cash flow of $8.8 million and record adjusted EBITDA1 of $20.7 million, all of which reflect increases compared to the prior year comparative period, demonstrating the Company’s leverage to high gold prices during Q3 2026.
- Year-to-Date Results Reinforce Full-Year Guidance: Year to date, the Company poured 21,476 ounces of gold and recognized revenue of $92.0 million, gross profit of $54.7 million, adjusted net income1 of $29.5 million, operating cash flow of $20.5 million and adjusted EBITDA1 of $54.1 million. Revenue, gross profit, adjusted net income, and adjusted EBITDA1 were all year-to-date records for the Company, and reflected increases compared to the prior year comparative period mainly due to the impact of a higher average gold price realized on higher ounces of gold sold. During the period, the Company continued to demonstrate leverage to high gold price levels and sold 20,789 ounces of gold at an average realized price1 of $4,423 per ounce. The Company is on track to meet its full-year production guidance of 25,000 to 30,000 ounces at an average cash cost per ounce of gold sold of between $1,400 to $1,600 per ounce.
- Plant Upgrades Leading to Better Throughput and Recovery: During Q3 2026 the Company continued to make progress on upgrades to the 2,000 tpd processing plant, including accelerated manufacturing for several key components, including installation of the pre-leach thickener, upgraded agitators & interstage screens, Aachen reactor, oxygen plant, apron feeder and belt magnet. The plant upgrades are in various stages of completion and have already begun to boost plant reliability and performance as evidenced by an increase in plant throughput (1,690 tpd) and an improvement in recovery (84.9%) in Q3 2026.
- High Recovery Rates Confirmed Through Additional Metallurgical Test Work: During Q3 2026, the Company reported results of ongoing metallurgical testwork as part of its current flowsheet optimisation and future expanded processing plant development. Recovery rates between 89% - 92% were achieved from metallurgical test work, which is above the 88% recovery rate assumed in the PEA. Testwork has led the Company to specify a Semi Autogenous Grind ("SAG") / Ball mill combination of 3,500 tpd. A letter of award for the new SAG / Ball mill was initiated, final contract execution was completed in early Q4 2026, initial downpayments have been made, and estimated completion is expected over the next 12 – 18 months. The existing, upgraded 2,000 tpd processing plant will be available to continue operating in conjunction with the new 3,500 tpd SAG / Ball mill processing plant, providing a significant upgrade in processing capacity versus the 3,000 tpd assumed in the PEA. The increase in throughput from the expanded processing plant is expected to produce average annual gold production in excess of the 62,000 ounces of gold originally anticipated in the PEA.
- Mine Plan Optimization Expected to Enhance Project Economics: During Q3 2026 the Company also initiated a revision of the life-of-mine plan as a result of the expected increase in processing capacity and the increase in gold price well above the PEA reserve estimate. Preliminary analysis indicates the potential for an expanded open pit, which could extend open pit operations, defer commencement of underground mining in the Main Zone and enhance total recoverable ounces. The Company is also evaluating the potential for an earlier start to underground mining of Stamford Bridge, alongside accelerating mining of the Eastern Porphyry. This is expected to improve the overall economics of the project. Throughput rates for the updated PEA will be determined by the revised mine plan, which will feed the new 3,500 tpd processing plant and existing, upgraded 2,000 tpd processing plant.
- Working Capital, Liquidity and Gold Inventory Continue to Strengthen: During Q3 2026 the Company continued to strengthen its working capital position through increased production, organically generated cashflow, improved liquidity and an increase in stockpile inventory. As a result, the Company’s current ratio has improved to a ratio of approximately 2.2 at May 31, 2026, including a cash balance of $26.8 million, an increase in net cash of approximately $19.1 million from year-end. Additionally, the run of mine ("ROM") stockpile inventory grew to an estimated 19,373 ounces of contained gold as at May 31, 2026, as the Company continued to access higher grade ore blocks in the pit and processed a higher proportion of high grade mined material. The ROM stockpile inventory has a fair market value of approximately $89.0 million at current market prices.
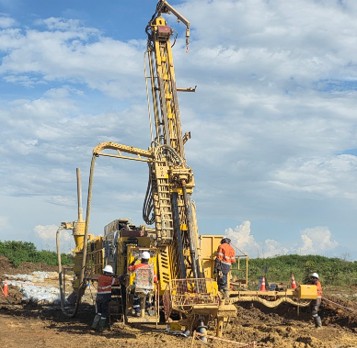
- Exploration Plans Underway Aimed at Upgrading Mineral Resource: During Q3 2026, the Company completed its 3-stage geophysical survey that commenced in Q4 2025. From this dipole-dipole survey, a total of 13 drill holes covering 1,850 meters has been identified for initial drill-testing across 9 sections as a preliminary test pattern. These holes, which are outside current known resources, are expected to be drilled in Q4 2026. Concurrently, in Q3 2026, approximately 50% of the fourteen-kilometer Eastern Porphyry drill program was completed with the Company’s newly commissioned Reverse Circulation ("RC") drill rig with the goal of upgrading the Mineral Resource at the Eastern Porphyry.
- Strong Health, Safety, and Environmental Track Record: The Company achieved zero lost time injuries ("LTI"), achieving the outstanding achievement of exceeding 6,000,000 manhours LTI-free.
Selected Operating and Financial Data
Select operating and financial information from the operation for the three and nine months ended May 31, 2026, follows below:
| Select Operating and Financial Data | ||||||||||||
| Unit | Three months ended May 31, 2026 | Three months ended May 31, 2025 | Nine months ended May 31, 2026 | Nine months ended May 31, 2025 | ||||||||
| Operating Data | ||||||||||||
| Ore Mined | k tonnes | 183 | 147 | 551 | 364 | |||||||
| Waste Mined | k tonnes | 2,272 | 1,195 | 5,429 | 2,937 | |||||||
| Total Mined | k tonnes | 2,455 | 1,342 | 5,979 | 3,301 | |||||||
| Strip Ratio | w:o | 12.4 | 8.1 | 9.9 | 8.1 | |||||||
| Mining Rate | tpd | 26,681 | 14,588 | 21,903 | 12,091 | |||||||
| Mining Cost | US$/t | $ | 3.02 | $ | 3.63 | $ | 3.93 | $ | 3.82 | |||
| Plant Ore Milled | k tonnes | 155 | 134 | 436 | 402 | |||||||
| Head Grade | g/t | 1.96 | 1.72 | 1.93 | 1.38 | |||||||
| Plant Utilization | % | 93 | 91 | 91 | 87 | |||||||
| Plant Recovery Rate | % | 84.9 | 67 | 81.4 | 71 | |||||||
| Processing Cost | US$/t | $ | 25.66 | $ | 14.60 | $ | 23.86 | $ | 14.20 | |||
| Plant Mill Throughput | tpd | 1,690 | 1,461 | 1,597 | 1,474 | |||||||
| Gold Ounces Poured | oz | 7,426 | 4,687 | 21,476 | 12,532 | |||||||
| Gold Ounces Sold | oz | 6,983 | 3,995 | 20,789 | 12,236 | |||||||
| Financial Data | ||||||||||||
| Revenue1 | $ ('000s) | 32,848 | 12,474 | 92,037 | 34,109 | |||||||
| Gross profit | $ ('000s) | 19,449 | 4,383 | 54,716 | 11,361 | |||||||
| Net income (loss) | $ ('000s) | 8,371 | 1,105 | (5,902 | ) | 1,301 | ||||||
| Adjusted net income2 | $ ('000s) | 10,077 | 1,989 | 29,464 | 3,750 | |||||||
| Adjusted EBITDA2 | $ ('000s) | 20,680 | 3,979 | 54,136 | 9,338 | |||||||
| Operating cash flow | $ ('000s) | 8,758 | 1,870 | 20,493 | 6,148 | |||||||
| Working capital5 | $ ('000s) | 36,304 | (3,274 | ) | 36,304 | (3,274 | ) | |||||
| Average realized price (gross)2 | $/oz | 4,704 | 3,122 | 4,427 | 2,788 | |||||||
| Average realized price (net)2,3,4 | $/oz | 4,703 | 3,114 | 4,423 | 2,829 | |||||||
| Cash cost2 | $/oz | 1,648 | 1,819 | 1,555 | 1,635 | |||||||
| 1Revenue includes immaterial amounts from the sale of by-product silver. | ||||||||||||
| 2Refer to the "Non-IFRS Performance Measures" section. | ||||||||||||
| 3Net of revenue and ounces of gold sold related to OCIM gold prepaid purchase agreement. | ||||||||||||
| 4Net of interest related to Auramet gold prepaid purchase agreement. | ||||||||||||
| 5Working capital for the three and nine months ended May 31, 2025 are adjusted for derivative liabilities which will only be settled by issuing equity of the Company and for the current portion of deferred revenue (non-cash) related to the Auramet prepaid gold purchase agreement. During Q2 2026, all outstanding warrants of the Company were either exercised or expired. In Q2 2026, the Company received total gross proceeds of approximately $21.0 million from the exercise of warrants. The Company now has a clean capital structure with no remaining warrants outstanding. | ||||||||||||
Figure 1: Buckreef Gold Open Pit Main Zone Aerial View
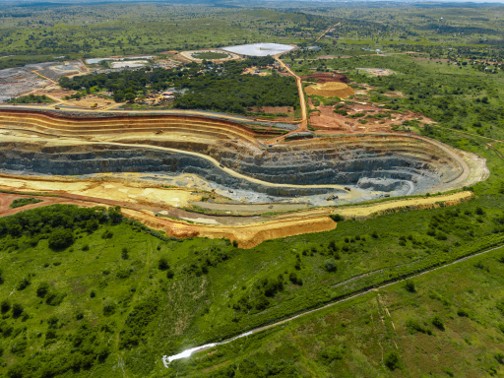
Figure 2: Buckreef Gold Mining Fleet
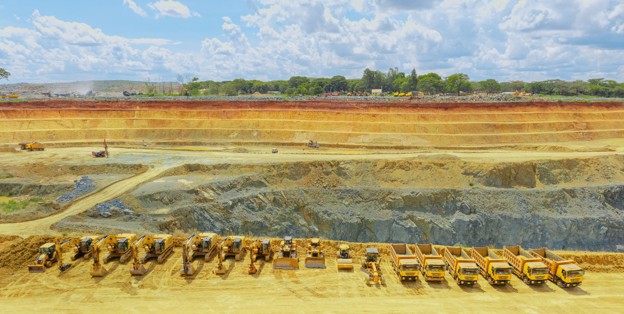
Figure 3: Buckreef Gold’s Ball Milling Circuit
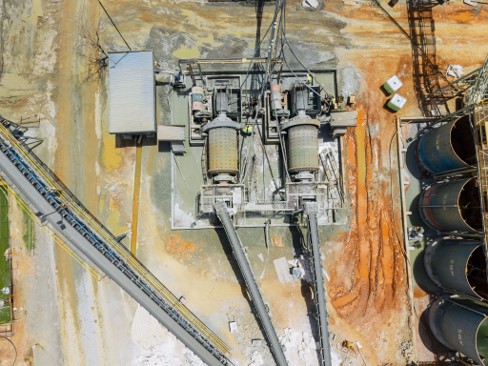
Figure 4: Installation of Oxygen Plant to Improve Slurry Oxidation
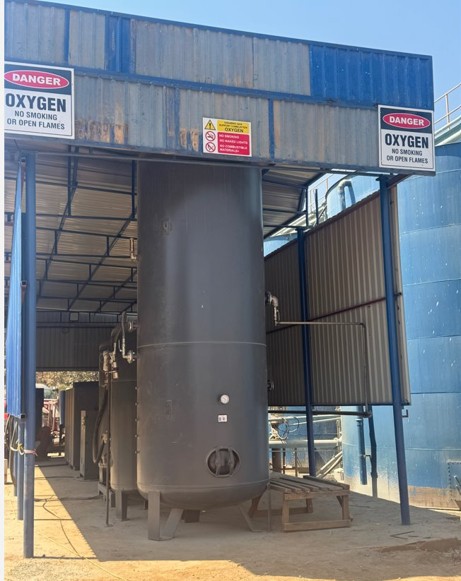
Figure 5: Installation of Pre-Leach Thickener
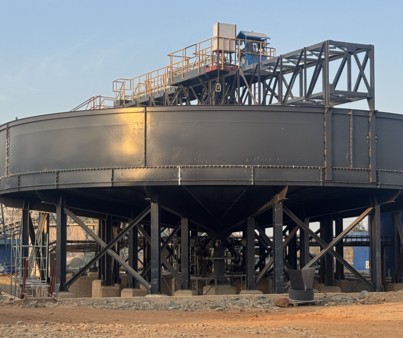
Figure 6: Aachen ® Reactor Installed and Commissioned to Improve Processing Efficiency
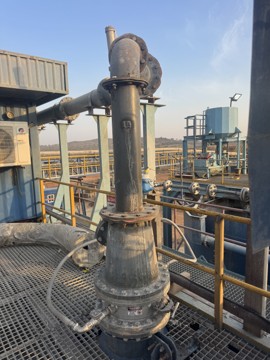
Figure 7: Buckreef Gold Inventory Stockpile
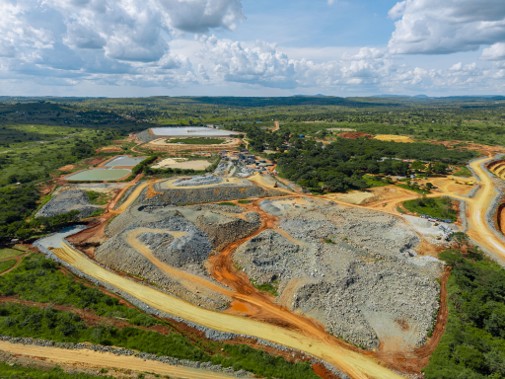
Figure 8: Reverse Circulation Drilling at Eastern Porphyry
Q3 2026 Results Conference Call and Webcast Details
When: Thursday, July 16 at 9:30 AM EST
Webcast link: https://www.renmarkfinancial.com/live-registration/third-quarter-2026-results-virtual-conference-call-tsx-trx-nyse-american-trx-oo2UH2LQXO
A replay will be made available for 30 days following the call on the Company’s website.
About TRX Gold Corporation
TRX Gold is a high margin and growing gold company advancing the Buckreef Gold Project in Tanzania. Buckreef Gold includes an established open pit operation and 2,000 tonnes per day process plant with upside potential demonstrated in the May 2025 Preliminary Economic Assessment (the "PEA"). The PEA outlines average gold production of 62,000 oz per annum over 17.6 years at 3,000 tonnes per day of throughput capacity, and a US$1.9 –US$2.6 billion pre-tax NPV5% at average life of mine gold prices of US$4,000-US$5,000/oz2. The Buckreef Gold Project hosts a Measured and Indicated Mineral Resource of 10.8 million tonnes ("MT") at 2.57 grams per tonne ("g/t") gold containing 893,000 ounces ("oz") of gold and an Inferred Mineral Resource of 9.1 MT at 2.47 g/t gold for 726,000 oz of gold. The leadership team is focused on creating both near-term and long-term shareholder value by increasing gold production to generate positive cash flow to fund the expansion as outlined in the PEA, grow Mineral Resources through exploration, and update the PEA with a larger capacity beyond 3,000 tpd. TRX Gold’s actions are led by the highest environmental, social and corporate governance ("ESG") standards, evidenced by the relationships and programs that the Company has developed during its nearly two decades of presence in the Geita Region, Tanzania.
Qualified Person
Mr. Richard Boffey, BE Mining (Hons) F AusIMM, Chief Operating Officer of TRX Gold Corporation, is the Company’s in-house Qualified Person under National Instrument 43-101 "Standards of Disclosure for Mineral Projects" ("NI 43-101") and has reviewed and assumes responsibility for the scientific and technical content in this press release.
For investor or shareholder inquiries, please contact:
Investors:
Investor Relations
IR@TRXgold.com
+1-437-224-5241
+1 844 GOLD TRX (844-465-3879)
www.TRXgold.com
Non-IFRS Performance Measures
The Company has included certain non-IFRS measures in this news release. The following non-IFRS measures should be read in conjunction with the Company’s Unaudited Interim Condensed Consolidated Financial Statements for the three and nine months ended May 31, 2026 filed on SEDAR+ and with the Securities and Exchange Commission ("SEC"), as well as the Company's audited consolidated financial statements included in the Company’s Annual Report on Form 40-F and Annual Information Form for the year ended August 31, 2025. The financial statements and related notes of TRX Gold have been prepared in accordance with International Financial Reporting Standards ("IFRS"). Additional information has been filed electronically on SEDAR+ and with the SEC and is available online under the Company’s profile at www.sedarplus.ca and the Company’s filings with the SEC at www.sec.gov and on our website at www.TRXgold.com.
Adjusted EBITDA
Adjusted EBITDA is a non-IFRS performance measure and does not constitute a measure recognized by IFRS and does not have a standardized meaning defined by IFRS. Adjusted EBITDA may not be comparable to information in other gold producers’ reports and filings. Adjusted EBITDA is presented as a supplemental measure of the Company’s performance and ability to service its obligations. EBITDA is frequently used by securities analysts, investors and other interested parties in the evaluation of companies in the industry, many of which present Adjusted EBITDA when reporting their results. Issuers present Adjusted EBITDA because investors, analysts and rating agencies consider it useful in measuring the ability of those issuers to meet their obligations. Adjusted EBITDA represents net income before interest, income taxes, and depreciation and also eliminates the impact of a number of items that are not considered indicative of ongoing operating performance.
The following table provides a reconciliation of net (loss) income and comprehensive (loss) income to Adjusted EBITDA per the Unaudited Interim Condensed Consolidated Financial Statements for the three and nine months ended May 31, 2026.
| Three Months Ended | Three Months Ended | Nine Months Ended | Nine Months Ended | |||
| May 31, 2026 | May 31, 2025 | May 31, 2026 | May 31, 2025 | |||
| Net income (loss) and comprehensive income (loss) per financial statements | 8,371 | 1,105 | (5,902 | ) | 1,301 | |
| Add: | ||||||
| Depreciation | 1,891 | 823 | 5,003 | 2,309 | ||
| Interest, net and other expense | 563 | 290 | 1,102 | 1,931 | ||
| Non-recurring severance and legal expenses | - | 1 | - | 431 | ||
| Income tax expense | 7,742 | 1,110 | 19,112 | 2,945 | ||
| Change in fair value of derivative financial instruments | - | 197 | 30,521 | (1,461 | ) | |
| Share-based payment expense | 2,113 | 453 | 4,300 | 1,882 | ||
| Adjusted EBITDA | 20,680 | 3,979 | 54,136 | 9,338 | ||
Average realized price per ounce gold sold
Average realized price per ounce of gold sold is a non-IFRS measure and does not constitute a measure recognized by IFRS and does not have a standardized meaning defined by IFRS. Average realized price per ounce of gold sold is calculated by dividing revenue by ounces of gold sold. It may not be comparable to information in other gold producers’ reports and filings.
The following table provides a reconciliation of average realized price per ounce of gold sold to revenue per the Unaudited Interim Condensed Consolidated Financial Statements for the three and nine months ended May 31, 2026.
| Three Months Ended | Three Months Ended | Nine Months Ended | Nine Months Ended | |||||||||
| May 31, 2026 | May 31, 2025 | May 31, 2026 | May 31, 2025 | |||||||||
| Revenue per financial statements | $ | 32,848 | $ | 12,474 | $ | 92,037 | $ | 34,109 | ||||
| Interest recognized from Auramet prepaid gold purchase agreement | (4 | ) | (34 | ) | (91 | ) | (64 | ) | ||||
| Revenue recognized from OCIM prepaid gold purchase agreement | - | - | - | (2,319 | ) | |||||||
| Revenue from gold sales | 32,844 | 12,440 | 91,946 | 31,726 | ||||||||
| Ounces of gold sold | 6,983 | 3,995 | 20,789 | 12,236 | ||||||||
| Ounces of gold sold from OCIM prepaid gold purchase agreement | - | - | - | (1,023 | ) | |||||||
| Ounces from gold sales (net of OCIM prepaid gold purchase agreement) | 6,983 | 3,995 | 20,789 | 11,213 | ||||||||
| Average realized price (gross) | $ | 4,704 | $ | 3,122 | $ | 4,427 | $ | 2,788 | ||||
| Average realized price (net) | $ | 4,703 | $ | 3,114 | $ | 4,423 | $ | 2,829 | ||||
Cash cost per ounce of gold sold
Cash cost per ounce of gold sold is a non-IFRS performance measure and does not constitute a measure recognized by IFRS and does not have a standardized meaning defined by IFRS. Cash cost per ounce may not be comparable to information in other gold producers’ reports and filings. The following table provides a reconciliation of total cash cost per ounce of gold sold to cost of goods sold per the financial statements for the three and nine months ended May 31, 2026.
| Three Months Ended | Three Months Ended | Nine Months Ended | Nine Months Ended | |||||||||
| May 31, 2026 | May 31, 2025 | May 31, 2026 | May 31, 2025 | |||||||||
| Cost of sales per financial statements | $ | 13,399 | $ | 8,091 | $ | 37,321 | $ | 22,748 | ||||
| Less: | ||||||||||||
| Depreciation | $ | (1,891 | ) | $ | (823 | ) | $ | (5,003 | ) | $ | (2,309 | ) |
| Costs related to settlement of OCIM gold purchase agreement | $ | - | $ | - | $ | - | $ | (1,125 | ) | |||
| Total cash cost | $ | 11,508 | $ | 7,268 | $ | 32,318 | $ | 19,314 | ||||
| Ounces of gold sold | 6,983 | 3,995 | 20,789 | 12,236 | ||||||||
| Less: | ||||||||||||
| Ounces related to settlement of OCIM gold purchase agreement | - | - | - | (422 | ) | |||||||
| Total ounces of gold sold net of OCIM gold purchase agreement settlement | 6,983 | 3,995 | 20,789 | 11,814 | ||||||||
| Cash cost per ounce of gold sold | $ | 1,648 | $ | 1,819 | $ | 1,555 | $ | 1,635 | ||||
Adjusted Net Income
Adjusted Net Income is a non-IFRS performance measure and does not constitute a measure recognized by IFRS and does not have a standardized meaning defined by IFRS. Adjusted Net Income may not be comparable to information in other gold producers’ reports and filings. Adjusted Net Income is presented as a supplemental measure of the Company’s performance. Adjusted Net Income is frequently used by securities analysts, investors and other interested parties in the evaluation of companies in the industry, many of which present Adjusted Net Income when reporting their results.
Management uses this measure internally to evaluate the underlying operating performance for the reporting periods presented. Management believes that Adjusted Net Income is a useful measure of performance because the items excluded from Net Income do not reflect the underlying operating performance of the core mining business and are not necessarily indicative of future operating results.
The Company presents Adjusted Net Income to enable investors, analysts and rating agencies to better understand the underlying operating performance of the core mining business through the eyes of management. Adjusted Net Income is a non-IFRS financial measure which excludes the following from net income (loss): foreign exchange losses (gains), interest and other expense, change in fair value of derivative instruments, and share-based expenses, which are not considered indicative of the Company’s underlying operating results for the reporting periods presented or for future operating performance.
The following table provides a reconciliation of net income (loss) and comprehensive income (loss) to Adjusted Net Income per the financial statements for the three and nine months ended May 31, 2026.
| Three Months Ended | Three Months Ended | Nine Months Ended | Nine Months Ended | |||||
| May 31, 2026 | May 31, 2025 | May 31, 2026 | May 31, 2025 | |||||
| Net income (loss) and comprehensive income (loss) per financial statements | 8,371 | 1,105 | (5,902 | ) | 1,301 | |||
| Add: | ||||||||
| Foreign exchange (gains) losses | (970 | ) | (56 | ) | (557 | ) | 97 | |
| Interest, net and other expense | 563 | 290 | 1,102 | 1,931 | ||||
| Change in fair value of derivative financial instruments | - | 197 | 30,521 | (1,461 | ) | |||
| Share-based payment expense | 2,113 | 453 | 4,300 | 1,882 | ||||
| Adjusted net income | 10,077 | 1,989 | 29,464 | 3,750 | ||||
The Company has included "Adjusted EBITDA", "average realized price per ounce of gold sold", "cash cost per ounce of gold sold" and "Adjusted Net Income" and as non-IFRS performance measures throughout this news release as TRX Gold believes that these generally accepted industry performance measures provide a useful indication of the Company’s operational performance. The Company believes that certain investors use this information to evaluate the Company’s performance and ability to generate cash flow. Accordingly, they are intended to provide additional information and should not be considered in isolation or as a substitute for measures of performance prepared in accordance with IFRS.
Forward-Looking and Cautionary Statements
This press release contains certain forward-looking statements as defined in the applicable securities laws. All statements, other than statements of historical facts, are forward-looking statements. Forward-looking statements are frequently, but not always, identified by words such as "expects", "anticipates", "believes", "hopes", "intends", "estimated", "potential", "possible" and similar expressions, or statements that events, conditions or results "will", "may", "could" or "should" occur or be achieved. Forward-looking statements relate to future events or future performance and reflect TRX Gold management’s expectations or beliefs regarding future events and include, but are not limited to, statements with respect to anticipated gold production, anticipated capital and exploration expenditures, continued operating cash flow, expansion of its process plant, estimation of mineral resources, ability to develop value creating activities, recoveries, subsequent project testing, success, scope and viability of mining operations, and the timing and amount of estimated future production.
Although TRX Gold believes the expectations expressed in such forward-looking statements are based on reasonable assumptions, such statements are not guarantees of future performance. The actual achievements of TRX Gold or other future events or conditions may differ materially from those reflected in the forward-looking statements due to a variety of risks, uncertainties and other factors. These risks, uncertainties and factors include general business, legal, economic, competitive, political, regulatory and social uncertainties; actual results of exploration activities and economic evaluations; fluctuations in currency exchange rates; changes in costs; future prices of gold and other minerals; mining method, production profile and mine plan; delays in exploration, development and construction activities; changes in government legislation and regulation; the ability to obtain financing on acceptable terms and in a timely manner or at all; contests over title to properties; employee relations and shortages of skilled personnel and contractors; the speculative nature of, and the risks involved in, the exploration, development and mining business. These risks are set forth in reports that TRX Gold files with the SEC and the various Canadian securities authorities. You can review and obtain copies of these filings from the SEC's website at http://www.sec.gov/edgar.shtml and the Company’s profile on the System for Electronic Document Analysis and Retrieval ("SEDAR+") at www.sedarplus.ca.
The disclosure contained in this press release of a scientific or technical nature relating to the Company’s Buckreef Project has been summarized or extracted from the technical report prepared in accordance with NI 43-101 – Standards of Disclosure for Mineral Projects on the Buckreef Gold Project ("Buckreef Gold") titled Preliminary Economic Assessment and Updated Mineral Resource Estimate of the Buckreef Gold Mine Project, Tanzania ("PEA") with an effective date of April 15, 2025. The PEA was prepared in accordance with NI 43-101 guidelines by P&E Mining Consultants Inc. ("P&E"). Input to this PEA was also provided by D.E.N.M. Engineering Ltd. ("D.E.N.M."). The information contained herein is subject to all of the assumptions, qualifications and procedures set out in, and is qualified in its entirety by reference to the full text of, the PEA and reference should be made to the full details of the PEA which has been filed with the applicable regulatory authorities and is available on the Company’s profile at www.sedarplus.ca.
The information contained in this press release is as of the date of the press release and TRX Gold assumes no duty to update such information.
1 Refer to "Non-IFRS Performance Measures" section.
2 Base case NPV5% of US$701.0 million pre-tax, or US$442.2 million after tax at consensus forecast case gold prices (US$2,707/oz year 1, US$2,646/oz year 2, US$2,495/oz year 3, US$2,400/oz year 4, US$2,245/oz thereafter).
Photos accompanying this announcement are available at
https://www.globenewswire.com/NewsRoom/AttachmentNg/a92ea247-f155-414d-8cc9-53d3f38bbd51
https://www.globenewswire.com/NewsRoom/AttachmentNg/97b34908-6907-4ac9-bd88-d7501c542bb5
https://www.globenewswire.com/NewsRoom/AttachmentNg/e5a6eb06-fb86-4cab-b3ab-ec27b7053e5b
https://www.globenewswire.com/NewsRoom/AttachmentNg/6b1a8c50-549c-4a5e-9638-5fc83cb65424
https://www.globenewswire.com/NewsRoom/AttachmentNg/6b67f6cf-9dd4-488b-9675-56672df9e9de
https://www.globenewswire.com/NewsRoom/AttachmentNg/4fab37b4-63a3-4a76-a209-cec5b5549c26
https://www.globenewswire.com/NewsRoom/AttachmentNg/cec083f0-a52d-49ef-bdaa-b8b6963b88b4
https://www.globenewswire.com/NewsRoom/AttachmentNg/39d512e0-e68e-4ada-8a70-c78ef4bf768b

